Contents
- Index
Cell based tables
Special tables may be set up that have different bases for every cell. To set these up yourself, you'll need to create a table of bases and use this to run your table. Both tables must be identical in shape and the table of bases must contain a sub-sample of the viewed table.
For example:
You could create a summary table by selecting the top-box scores from a group of 5 point scores. If you wanted to base this table on 'positive responses only' you would then set up a table where each row was a net of positive codes (1-5). To base the first table on the second, drag the cell base variable to the base area and check the Cell bases check-box on the Bases dialog box.
You may find Cell based tables pre-defined in your project file. To understand them, please see the tables below:
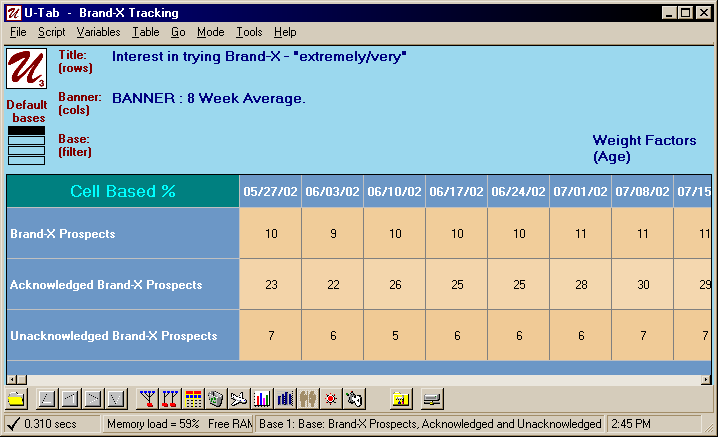
In the first column, the above table shows that 10% of Brand-X prospective users would be interested in trying the product, however, by defining a sub-sample of these (the acknowledged prospects), we see that figure increase to 23%.
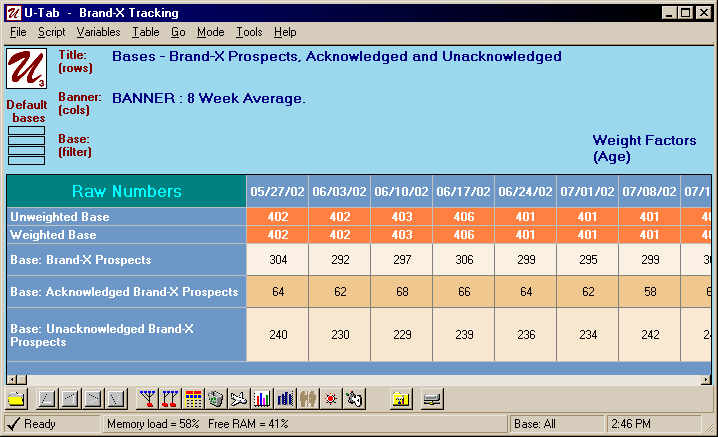
The table below contains the bases used for the above table and shows that, for the first column, we have a sample of 304 prospective users, 64 of which are "acknowledged".
If you want to see what your cell based tables are percentaged on, simply Right click the "Mode" button (the top-left cell in the table, and select the "Show cell bases" item from the pop-up menu.
See also: Special variables